InSite EFS Web-Mapping Tool
Welcome to the InSite EFS Web-Mapping Tool
This tool is designed to be a comprehensive, interactive mapping platform used to access and visualize education focused data. Our goal is to support informed decision-making for all stages of a schools life-cycle, ranging from start-ups looking for a place to locate, to established networks planning their future. Built using ESRI’s cutting-edge Experience Builder technology, this platform integrates a variety of dynamic data layers and features to cover all scenarios a school might encounter, and can be accessed via laptop, tablet, or mobile device.
Included in the Web Map are interactive layers showcasing your target market’s Real Estate, Educational, Transit, Government, Home Construction, Zoning, and Demographic Data. These data sets are designed to empower you with actionable information for strategic planning and analysis.
At InSite EFS, we are committed to making this tool as valuable and as personalized as possible. Should you need additional data or wish to integrate internal datasets into your Web-Map, please contact our GIS department with your request.
Thank you for choosing InSite EFS, and we look forward to supporting your organization’s success.
GIS Department Contacts
Ryan Keller: ryan@insiteefs.com
James Allan: james@insiteefs.com
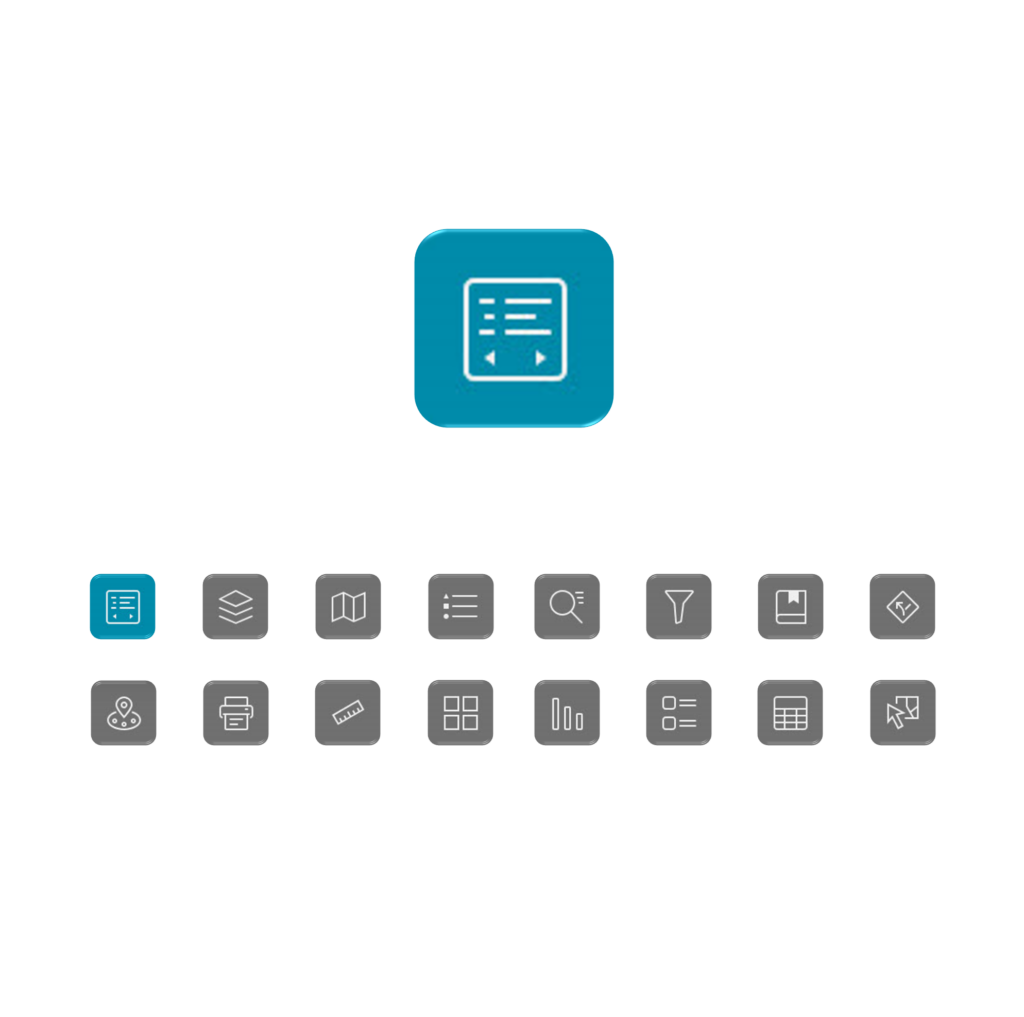
Menu
The Menu Widget provides a navigational interface for switching between pages or tabs within the Web App. Standard pages include, but are not limited to:
- Overview: Main landing page with all geospatial interactive data.
- Dashboard(s): Detailed demographic breakdowns for community or geopolitical areas that can show historical trends or comparisons through charts.
- Data Records: A simplified overview page with access to tabular data records, with the ability to select, highlight, and export.
Click image to enlarge
Map Layers
The Map Layers Widget is a list of available data layers whose visibility can be toggled on and off by clicking the blue box to the left of the layer name.
Some layers are grouped to better organize the available data, which can be identified by an arrow to the left of the group layer name. The Layers widget can be moved/removed/added back to the map to accommodate your specific use.
Click image to enlarge
*Please note, that the “parent” layer (group layer name) must be turned on to view the “child” layers within the group.
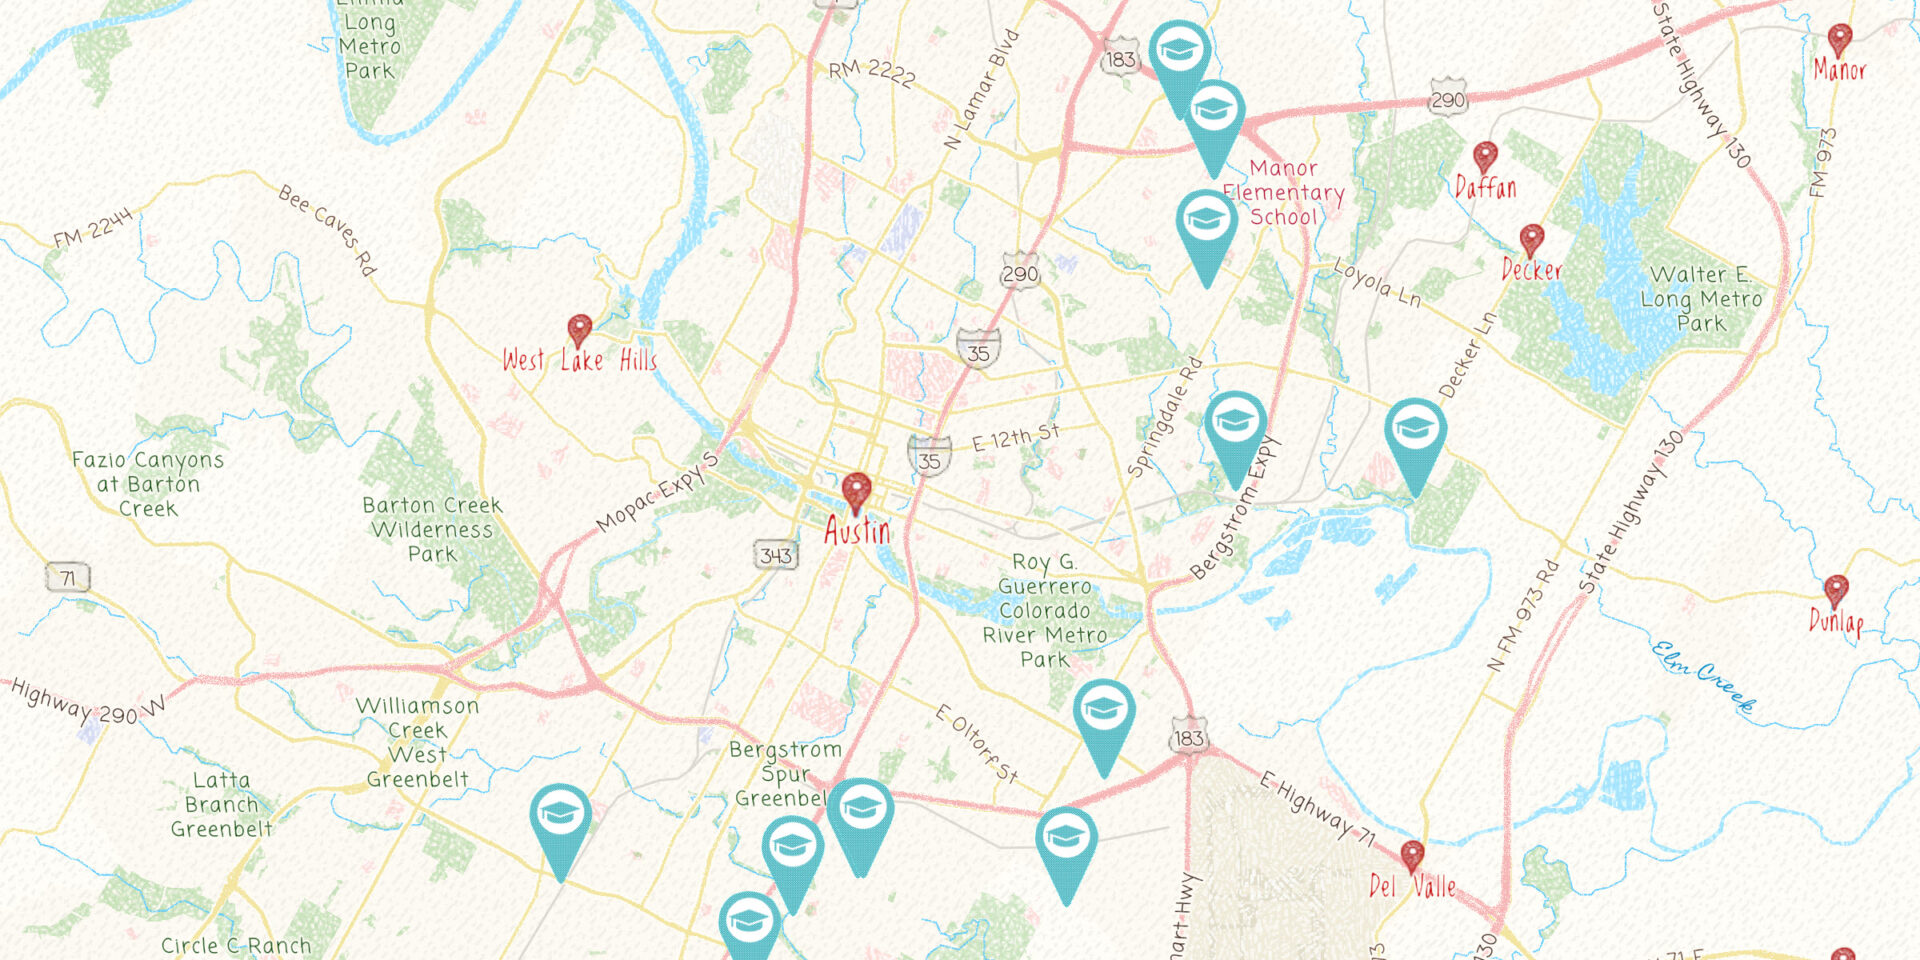
Map Scene
The Map Scene is the mapping surface itself. Users can pan around, zoom in or out, and interact with active layers by clicking on a feature.
To pan around, click and hold to pull the map in the desired direction. You can zoom in/out by using the scroll bar on your mouse, or pinching the screen on a mobile device or tablet.
Click image to enlarge

Map Legend
The active layers legend displays a brief description the active data layer(s) that are currently visible on the map. The legend window can be scrolled to view symbology listed further down, and can also be collapsed to enlarge the map scene by pressing the blue arrow.
Click image to enlarge
Search Bar
The Search Bar can be used to find a location using an address or name of the place of interest.
Click image to enlarge

Filters (Layers)
Layer filters allow more advanced users to extract data on their own by creating a unique set of expressions. These expressions are logic based and depend on attribute values, spatial relationships, or quantitative criteria to provide a fully customized work experience.
Click image to enlarge
Filter (Widgets)
The Filter Widget assists users in refining large datasets by prompting specific or predefined values and attributes using a built in template. The template promotes a more efficient experience that is easy to use for the most novice user. Multiple filter widgets can be added by request to any webmapping tool to suit your current needs.
Click image to enlarge
Bookmark
The Bookmark widget can save the current map extent for later reference. Simply navigate to extent and location you want, open the widget and click the “+” button, then name your bookmark to save.
Click image to enlarge
Directions
The Directions widget can provide directions and map routes between locations. The locations can be input by clicking inside the address box and then clicking on the map, or by entering an address or place manually.
Uses may also select the desired direction, time of day, and transportation type. If you would like to save the directions, you can do so by pressing the “Save” button below.
Click image to enlarge
Near Me
The Near Me Widget lets users highlight features and locations within a set distance, supporting interactive searches and allowing for quick data exports. It’s ideal for location-based analysis to aid in decision-making by visualizing spatial relationships between facilities.
Click image to enlarge
Export Map
The Print widget can be used to create printable PDF files of the current map extent. Make sure your desired layers and zoom level are set, and then select the print widget. Choose a template, and create name, then select the “Print” button.
 Click image to enlarge
Measurement
The Measurement widget can be used to measure the distance or area. Upon selecting the widget, choose between distance or area, then select the unit of measurement desired.
Press the “Enter” key or double click to finalize your measurement.
Click image to enlarge
Basemap
The Basemap Gallery can change the background of the map. The tool is set by default to satellite imagery, but the user can choose from an array of other basemaps to fit their specific needs.
Simply select the Basemap widget, scroll, and click on the desired basemap to change the background.
 Click image to enlarge
*Please note: you may need to turn off the “Hybrid Reference Layer” depending on your selection.
Dashboard
The Dashboard page provides historical demographic breakdowns for the sub-geographies of cities or regions. These geographies can range from communal neighborhoods to geopolitical boundaries like wards and city council districts. Charts reflect selections on the map to visualize the differences within these regions which assist in showing the absence (or saturation) of educational resources.
click image to enlarge

Demographics
Adjust the year to view the changes and trends of the most important education related demographics. Use the information panel to get the contact information of your local representative and details on the number of schools and students attending them for each geographic region.
click image to enlarge
Data Records
The Data Records page hosts an interactive table based tool that combines the basic functions of a spreadsheet with the spatial geometry of a map. The user can type in or sort specific criteria to reduce the records of the layer displayed, which is then mirrored on the map. The narrowed list can then be exported in csv or json form.
click image to enlarge
Select
The Select Widget enables users to select multiple features directly from a map to focus attention and evaluation on a certain area or number of records. It supports multiple selection methods, including point, rectangle, lasso, and polygon, allowing users to refine and export their results.
click image to enlarge
Let’s Collaborate
Contact us to find out how working with InSite can help your organization move forward.